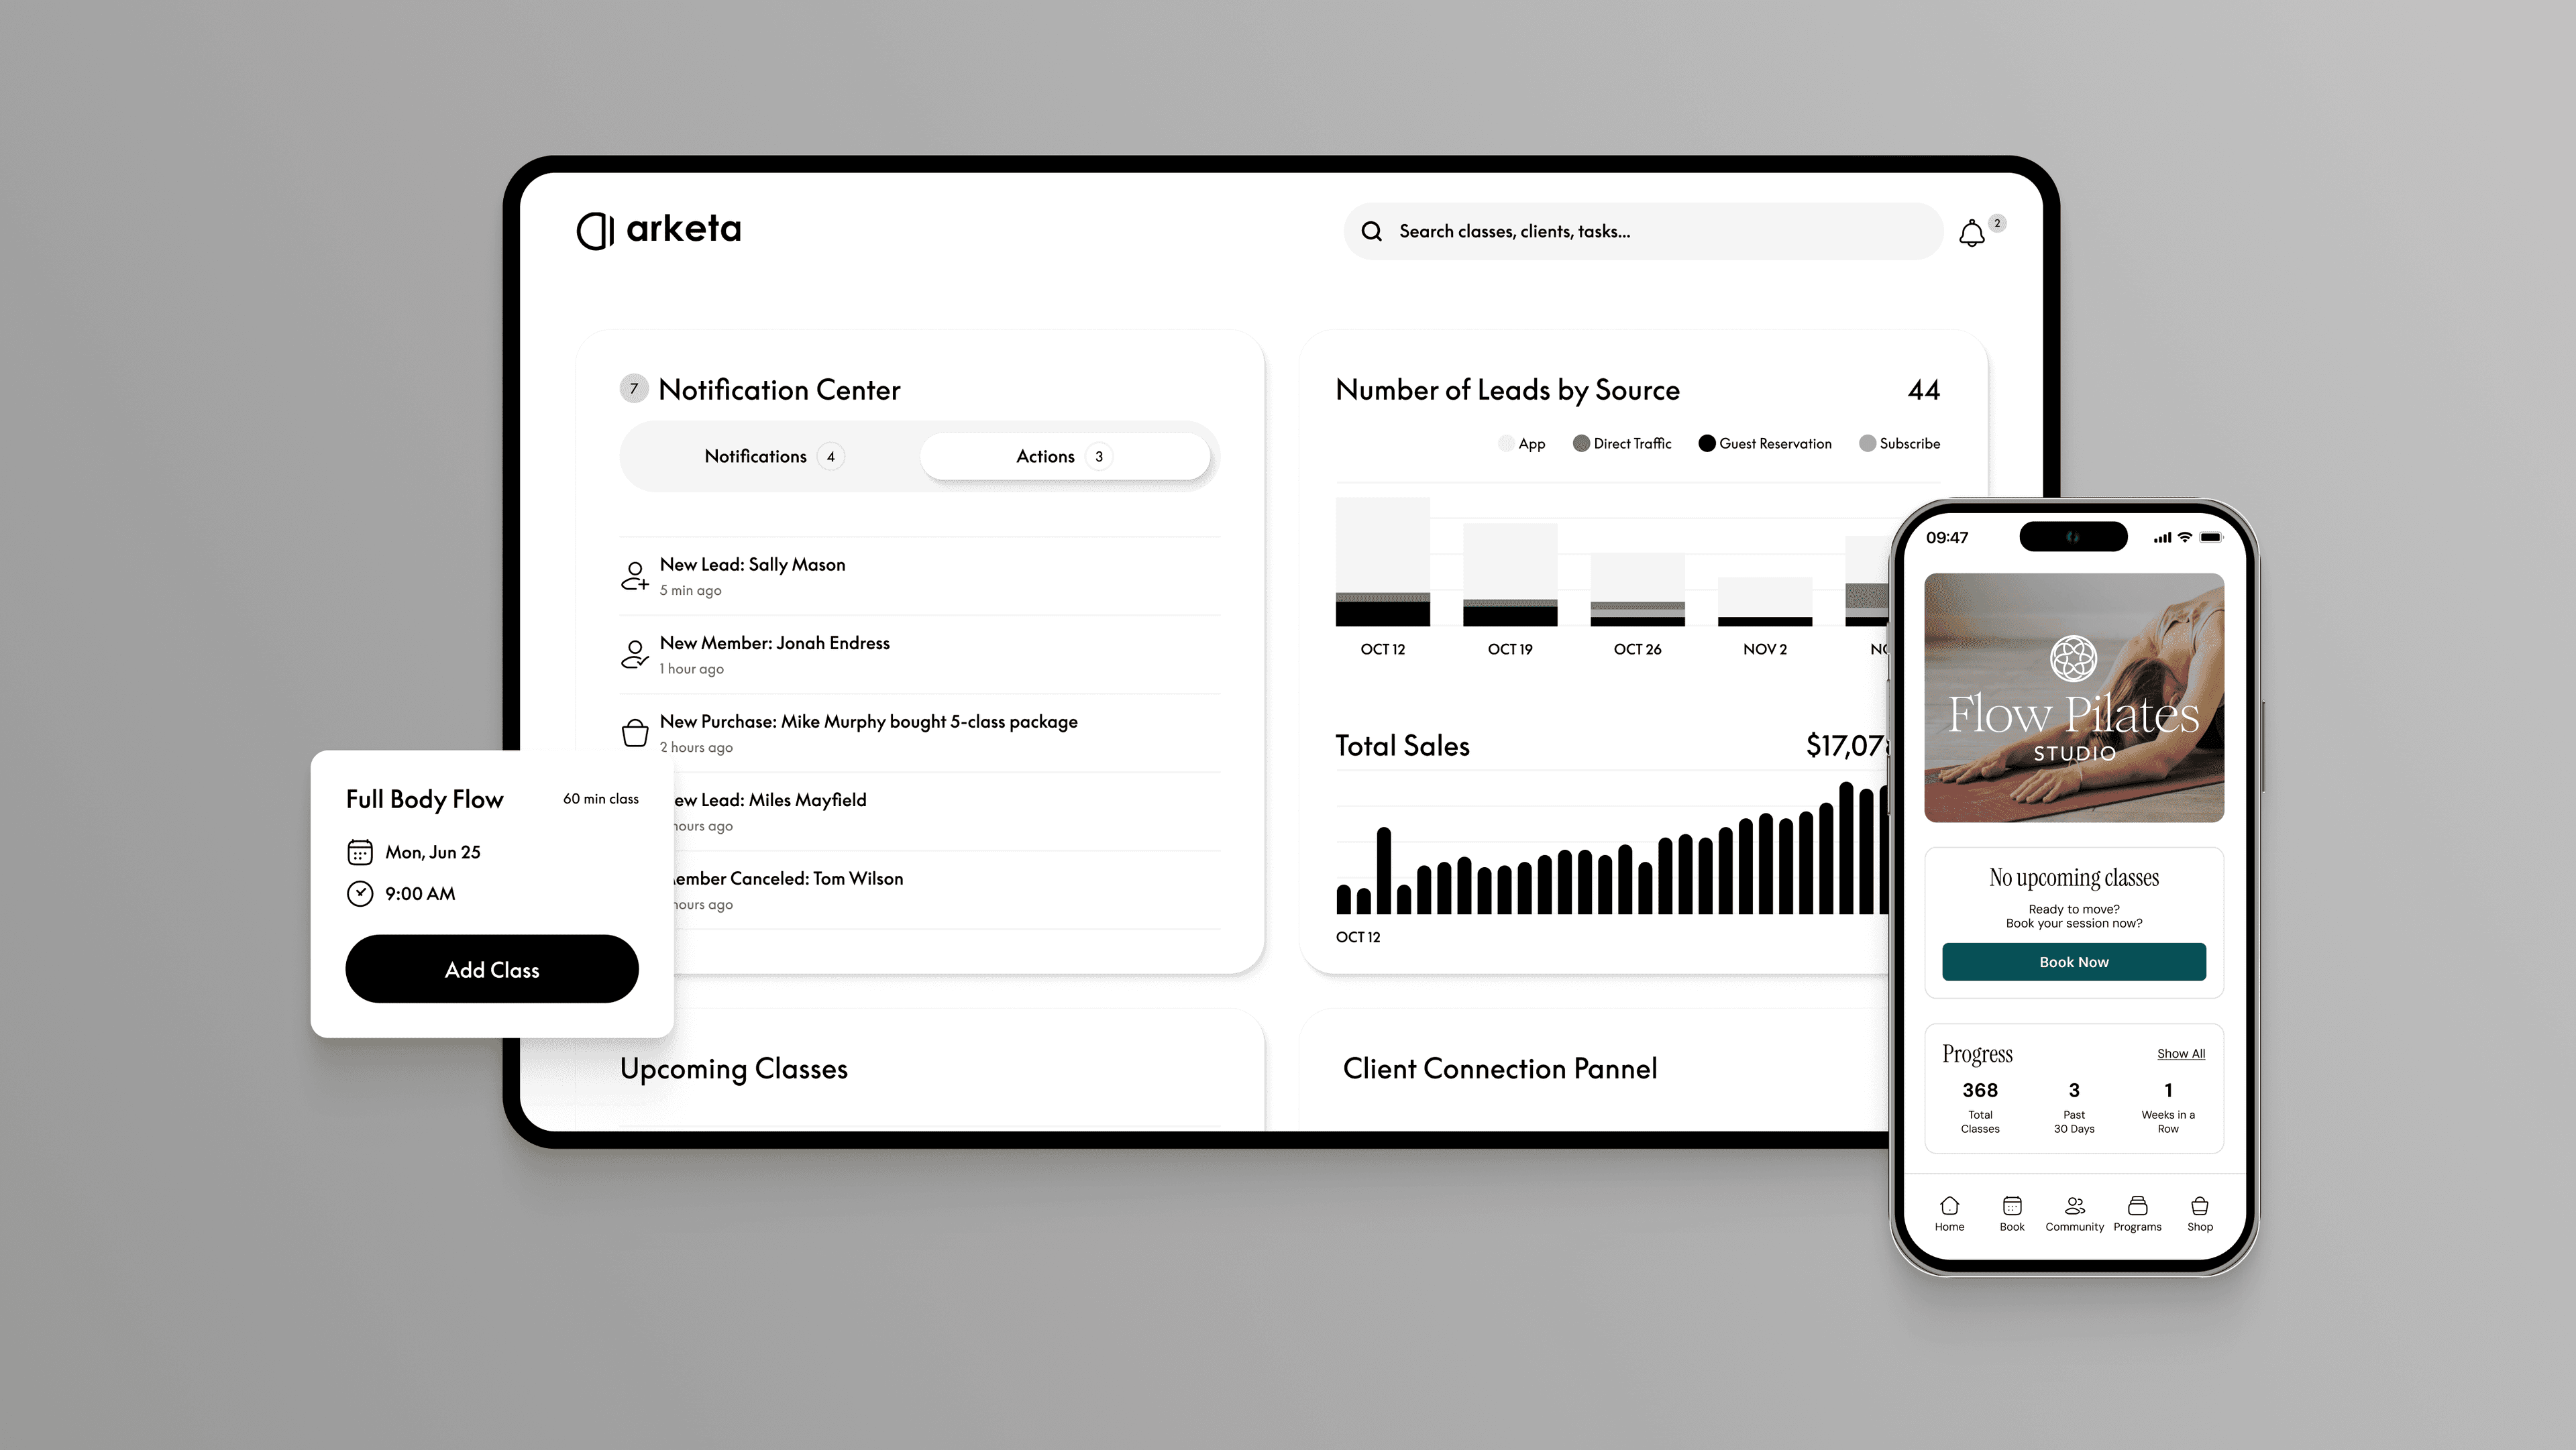
Build your own analytics dashboard
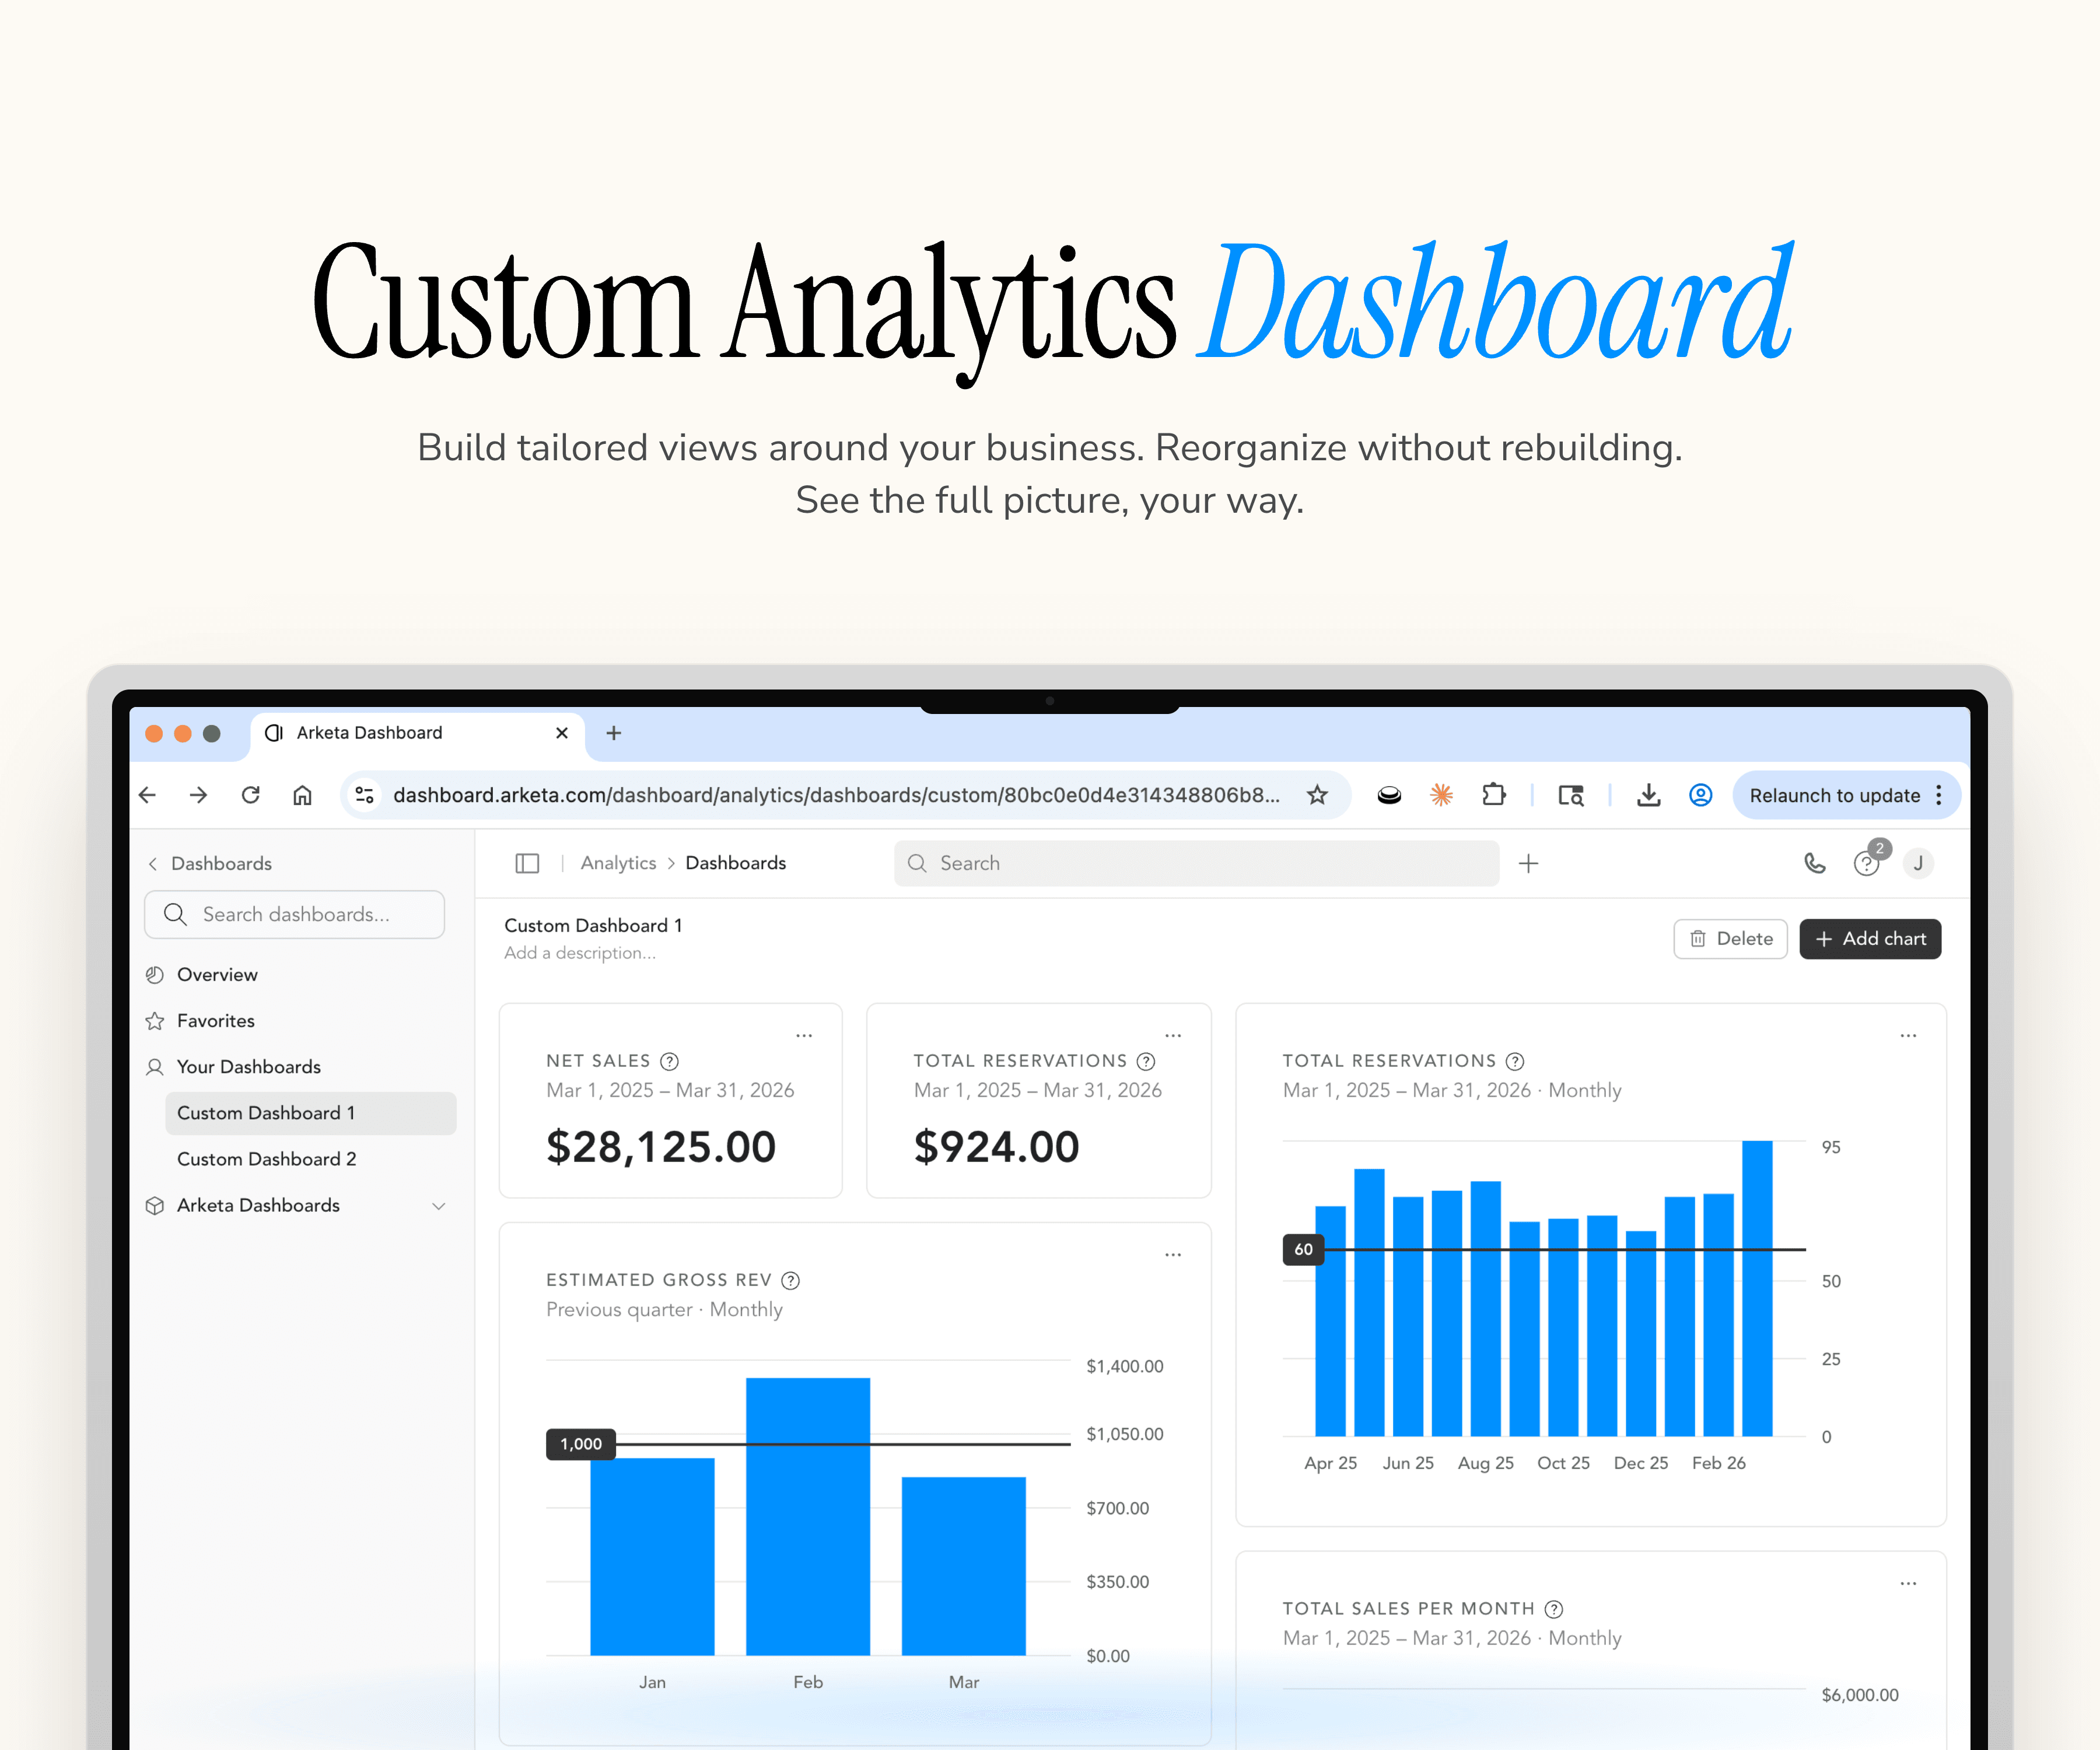
Introducing Custom Analytics Dashboards. Arketa is the only studio management platform that lets you build charts from scratch, pick the metrics that matter to your studio, and arrange them into dashboards designed for how your team actually works.
Studio owners spend hours every week trying to answer what's actually driving growth? The answer is usually buried in a CSV that needs to be cleaned, formatted, and dropped into a spreadsheet, and by the time it's ready, a week's gone by.
That's why we built Custom Analytics Dashboards. Arketa is the only studio management platform that lets you build charts from scratch, pick the metrics that matter to your studio, and arrange them into dashboards designed for how your team actually works. Every role on your team can get a view tuned to the work they do, so no one is sifting through data that isn't relevant to them.
Book a demo to see how it works.
Your revenue drivers aren't the same as the studio down the street
No two studios run the same way. A Pilates reformer studio cares about different numbers than a dance studio juggling recital prep, skill progressions, and a mix of group classes and private lessons. A single-location yoga studio in its third year has completely different priorities than a multi-location fitness brand trying to understand which markets are performing.
When a platform tries to build one dashboard that works for all of them, it ends up working well for none of them. You get buried in metrics you don't need while the ones that actually matter to your business are nowhere to be found.
Custom dashboards let you build for the studio you actually run, not the average of every studio.
Build a no-code dashboard tailored for your needs
Because your dashboards live inside Arketa, they're always current. No exports, no integrations, no manually refreshing a Google Sheet. When a booking happens or a membership sells, your numbers update automatically.
From there, build the view that answers the questions you're actually asking:
KPI cards so you know in seconds whether this week is trending up or down from last, without doing the math
Line charts with goal lines so you can see before the month ends whether you're on pace, not after
Column and bar charts to spot where performance is concentrated — by category, location, pricing option, or revenue type
Pie and donut charts when you need to understand what's driving the bulk of your revenue or attendance at a glance
Tables when you want the actual numbers behind the visual
Switch chart types any time without losing your data. Move and duplicate charts across dashboards so your front desk view and your owner view stay in sync without rebuilding from scratch.
A few examples to get you started
The point of custom dashboards is that they're yours, so take these as a starting point or examples of what you can create.
If you're class-driven: Know which class types are filling and which ones aren't before you make your next scheduling decision. Track attendance and reservations by category so when it's time to add a time slot, drop an underperforming service type, or pitch a new format to your team, you're working from data instead of instinct.
If you want to understand your revenue: Know exactly which offerings, pricing tiers, and channels to double down on. Break down net sales by category, pricing option, and revenue category so your next promotion, price change, or program launch is pointed at what's actually working.
If you're a multi-location studio: Know which location needs attention before a problem becomes a pattern. Segment attendance, reservations, and revenue by location so you're making staffing, scheduling, and investment decisions based on real performance, not assumptions.
If you're focused on memberships: Know when to act on retention before members walk out the door. Track subscription purchases over time, filter by pricing option to see which tiers are growing, and monitor status so your next win-back campaign or pricing adjustment is timed right.
The studios running the tightest operations aren't working harder, they're just looking at the right metrics and acting on them.
Interested in seeing what a dashboard built for your studio would look like? Schedule a time with our team to find out.
You may like
Introducing Achievements: Turn client milestones into long-term revenue
Read more